
Data Dashboard
In **AI Management > Data Dashboard > LLM Log Monitoring**, you can view the current organization's model request volume, error rate, Token usage, and trends, and identify service providers or models that require further investigation.
In AI Management > Data Dashboard > LLM Log Monitoring, you can view the current organization's model request volume, error rate, Token usage, and trends, and identify service providers or models that require further investigation.
Before you begin
Sign in to SuperMagic and enter the organization management console for the organization you want to query.
Confirm that the correct organization is selected. LLM Log Monitoring only displays data for the current organization.
Confirm that your account has the required AI Management and Data Dashboard viewing permissions. Page visibility depends on the current organization configuration and account permissions.
Prepare the time range, AI service provider, or model information that you need to analyze, if possible.
Monitoring data is used to identify changes in request volume, error rate, and usage. It does not constitute a complete evaluation of model quality or business outcomes. After identifying an anomaly, continue by viewing the corresponding model audit records.
Enter LLM Log Monitoring
Click AI Management at the top of the management console.
Expand Data Dashboard in the left navigation.
Click LLM Log Monitoring.
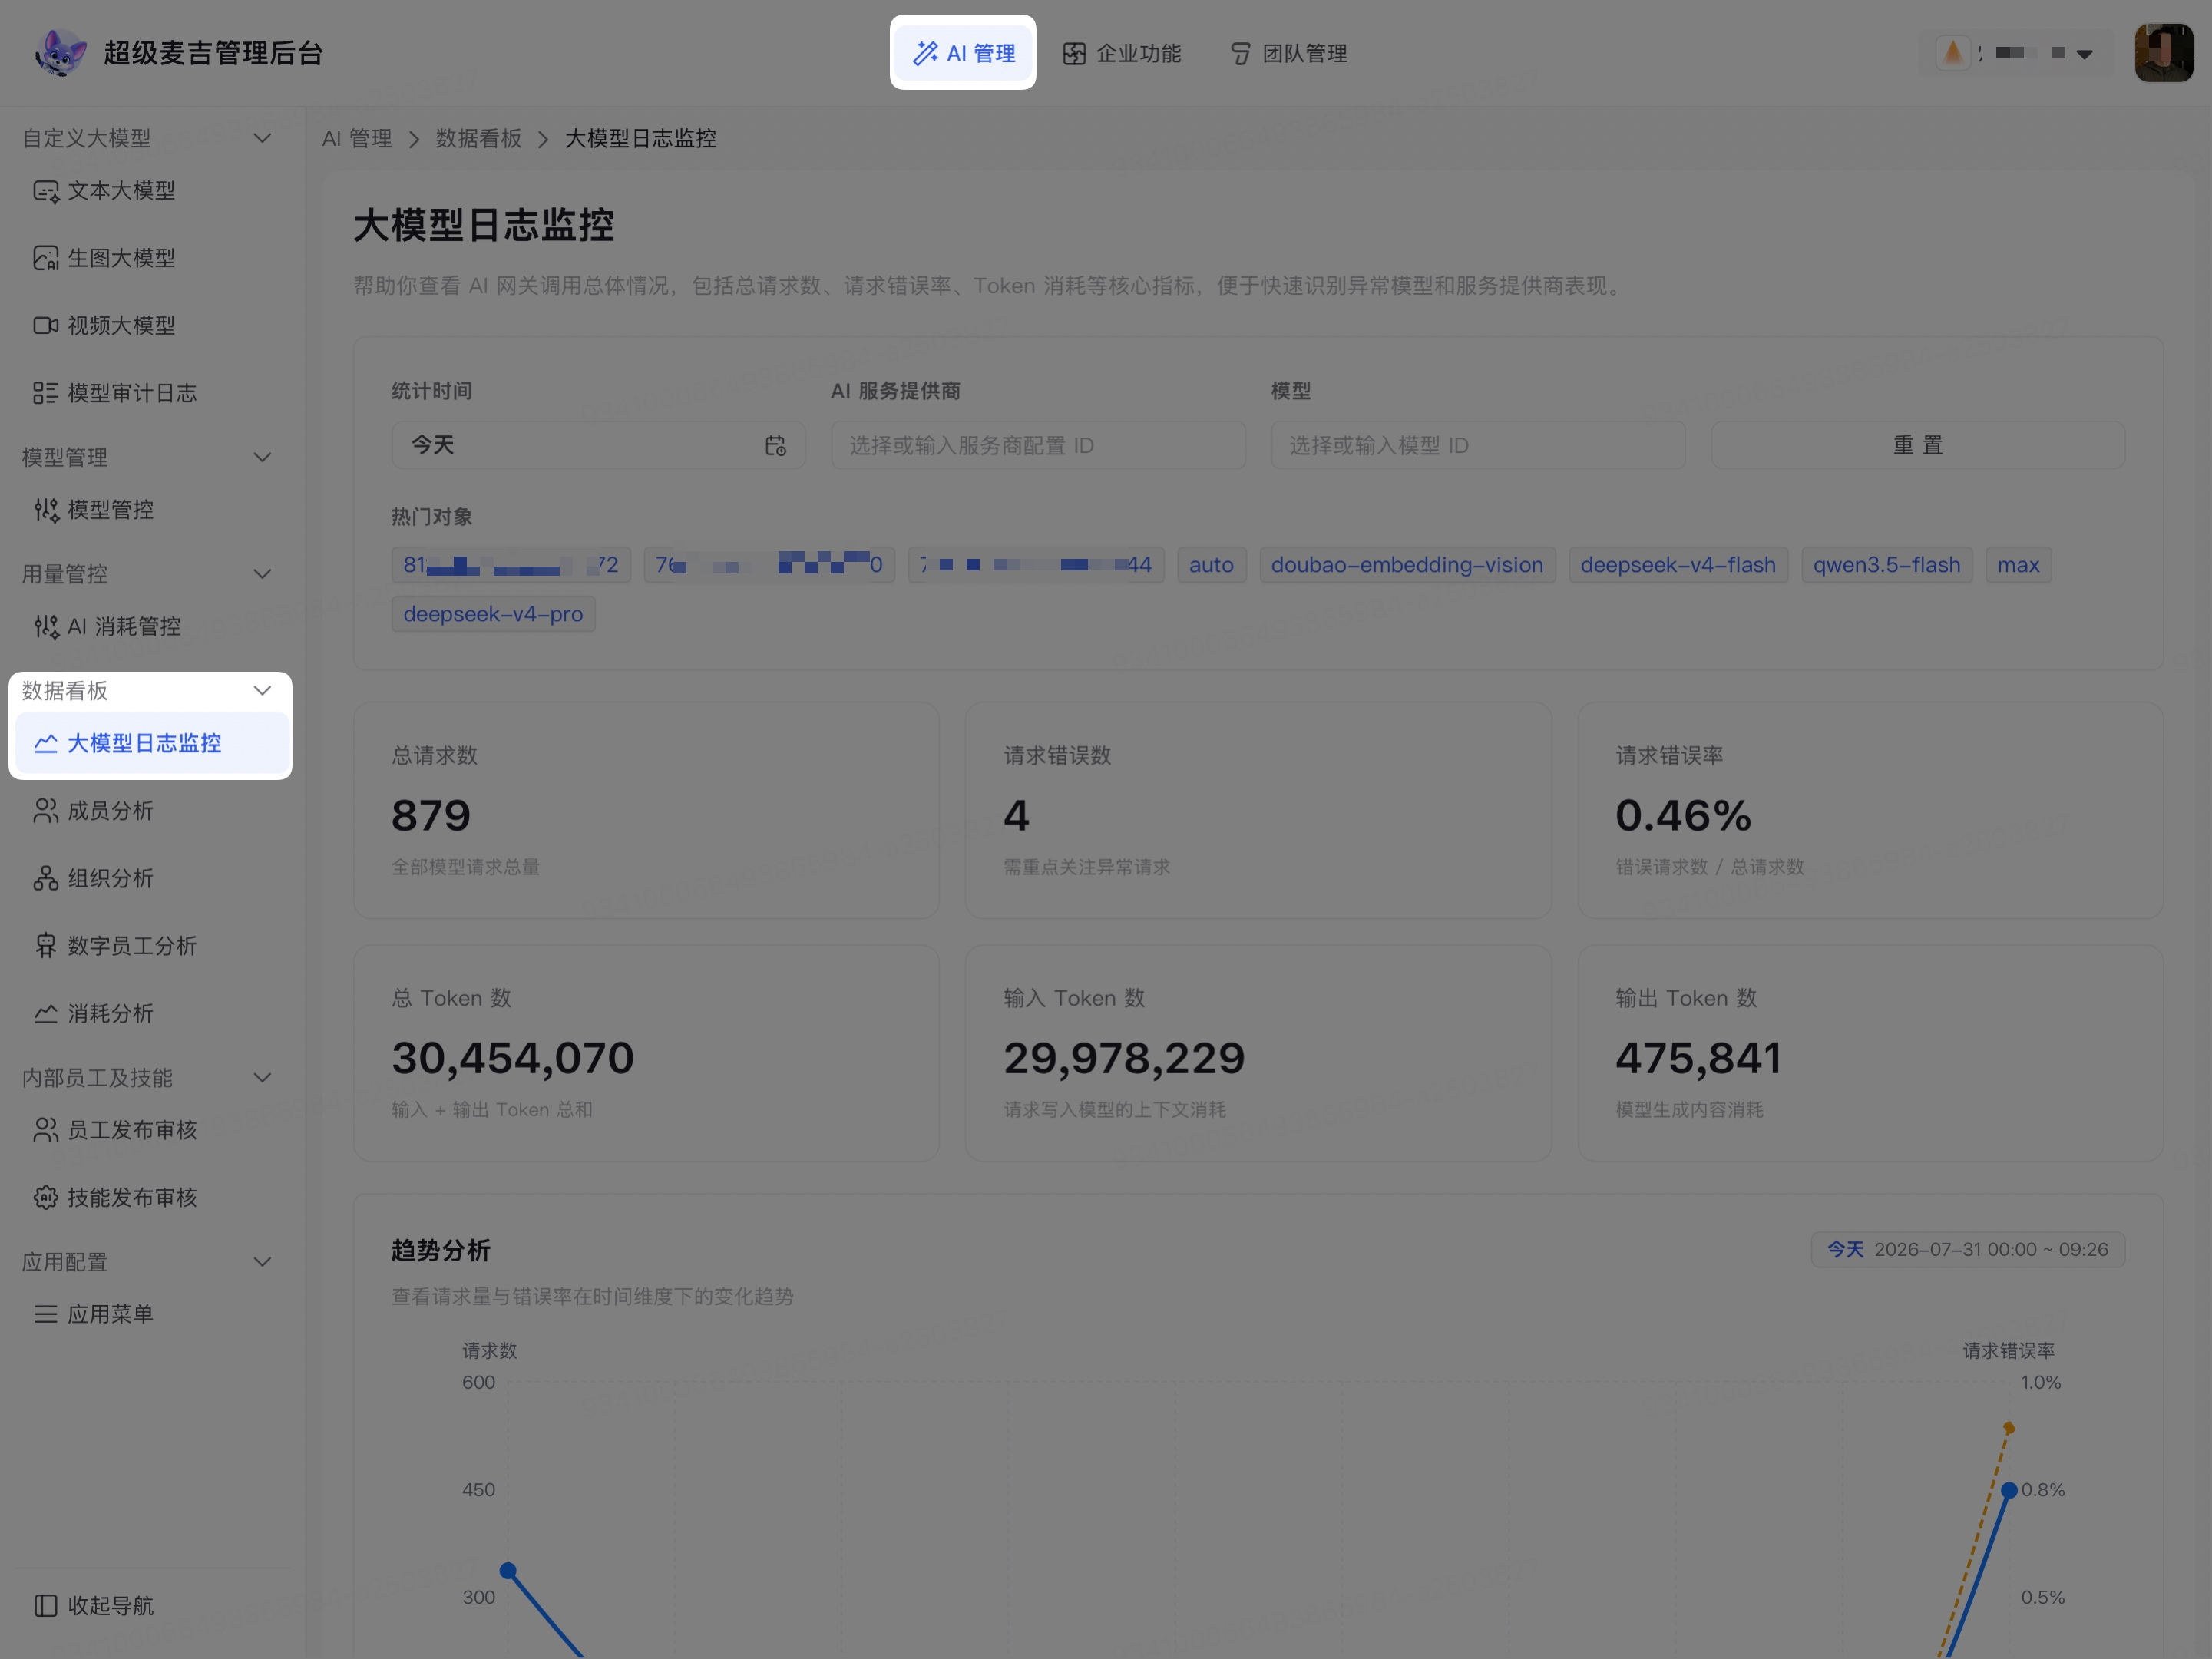
The page displays core metrics, trend analysis, and request count analysis for the current statistics period and filter range.
View core metrics
LLM Log Monitoring displays the following metrics based on the current filter conditions:
Metric | Meaning |
|---|---|
Total Requests | The total number of model requests made by the current organization within the filter range. |
Request Errors | The number of requests made by the current organization within the filter range that encountered errors. |
Request Error Rate | The proportion of request errors out of total requests. |
Total Tokens | The sum of input Tokens and output Tokens. |
Input Tokens | The context consumed by requests sent to the model. |
Output Tokens | The content generated by the model. |
The values in the screenshot belong to a specific statistics snapshot. After you adjust the time, service provider, or model, the metrics are recalculated based on the new conditions.
Filter monitoring data
LLM Log Monitoring supports filtering by statistics period, AI service provider, and model. You can also click Popular Items to quickly apply filter conditions.
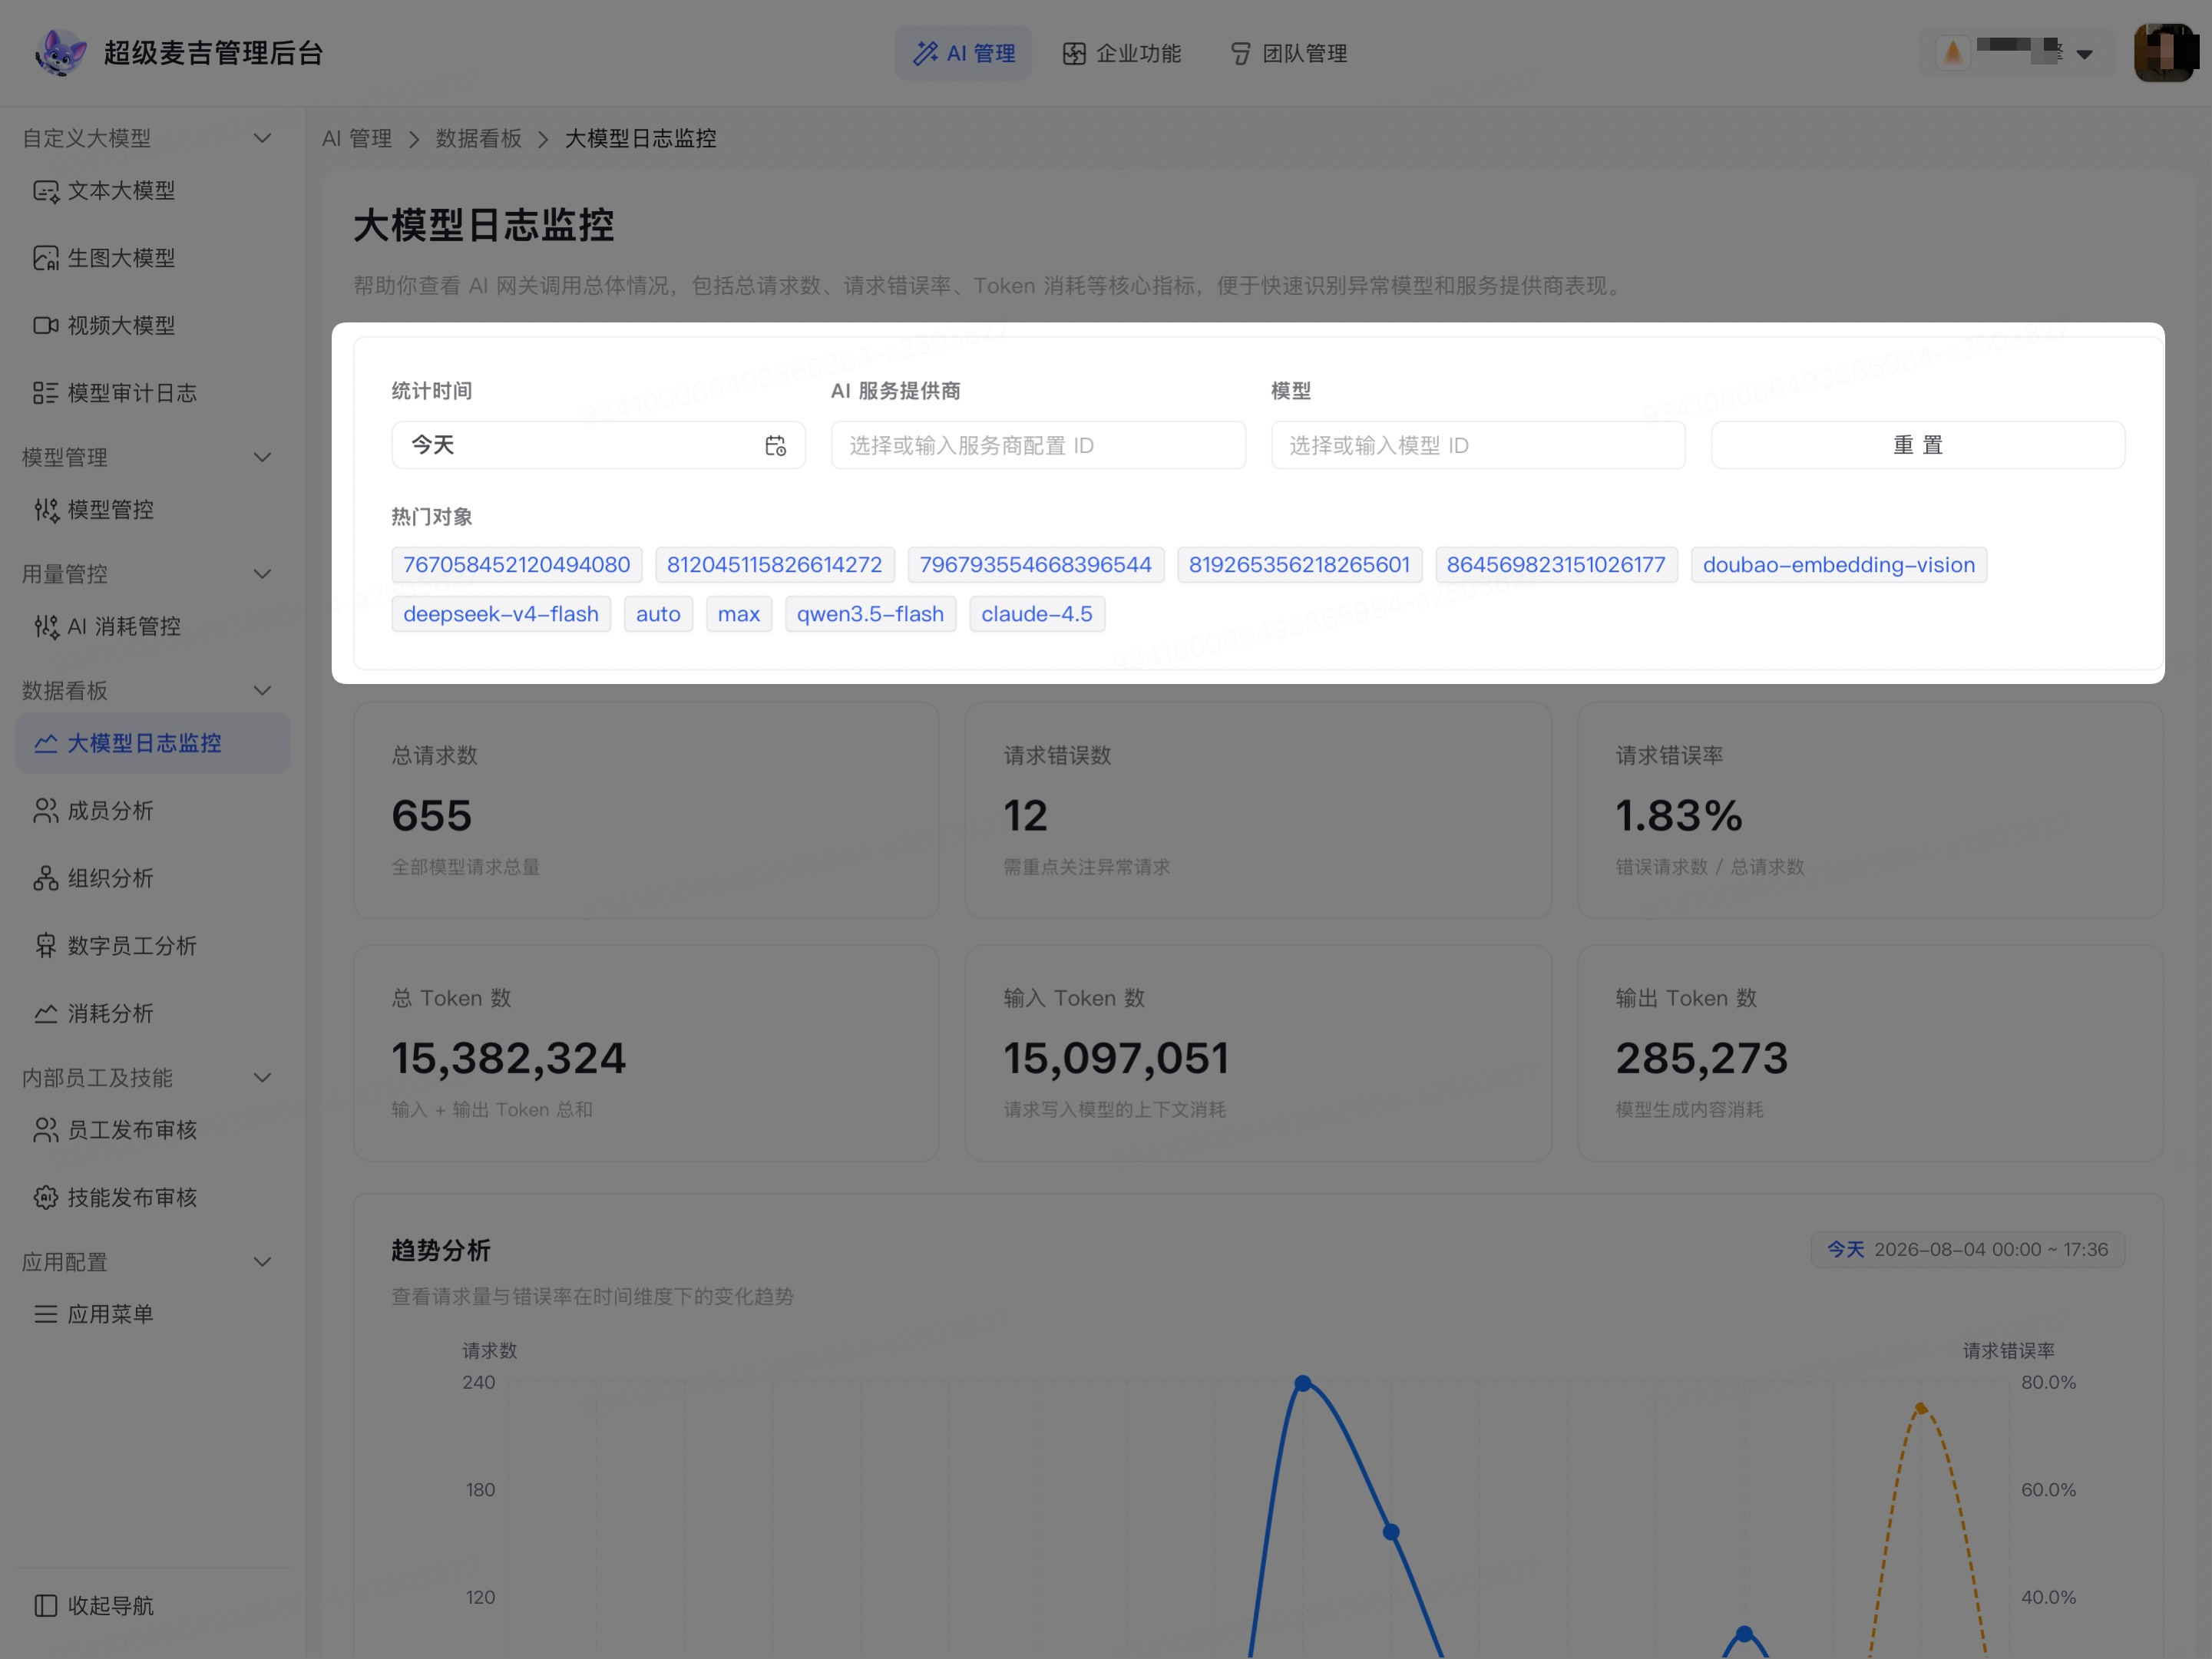
Click Statistics Period.
Select the time range you want to analyze.
Check the actual start and end times displayed in the upper-right corner of the trend chart.
Click AI Service Provider, and select or enter the service provider configuration ID.
To further narrow the range, click Model, and select or enter the model ID.
View the updated metrics and charts.
Popular Items on the page displays commonly used service providers and models. You can also click an item to quickly apply its filter conditions.
Total requests, errors, error rate, Token count, and the charts below are recalculated based on the current filter conditions. To restore all statistics for the current organization, click Reset.
View trends and request count analysis
View trend analysis
In Trend Analysis, compare the two curves:
Blue Requests: Displays the model request volume at each point in time.
Orange Request Error Rate: Displays the request error rate at each point in time.
If the request volume or error rate increases significantly at a specific point in time, first record that time range, and then go to Request Count Analysis to confirm the corresponding service provider and model.
View request count analysis
In Request Count Analysis, you can view the following metrics by service provider and model:
Total Requests.
Request Errors.
Request Error Rate.
Click the sort button next to a column header to prioritize objects with higher request volumes or more errors.
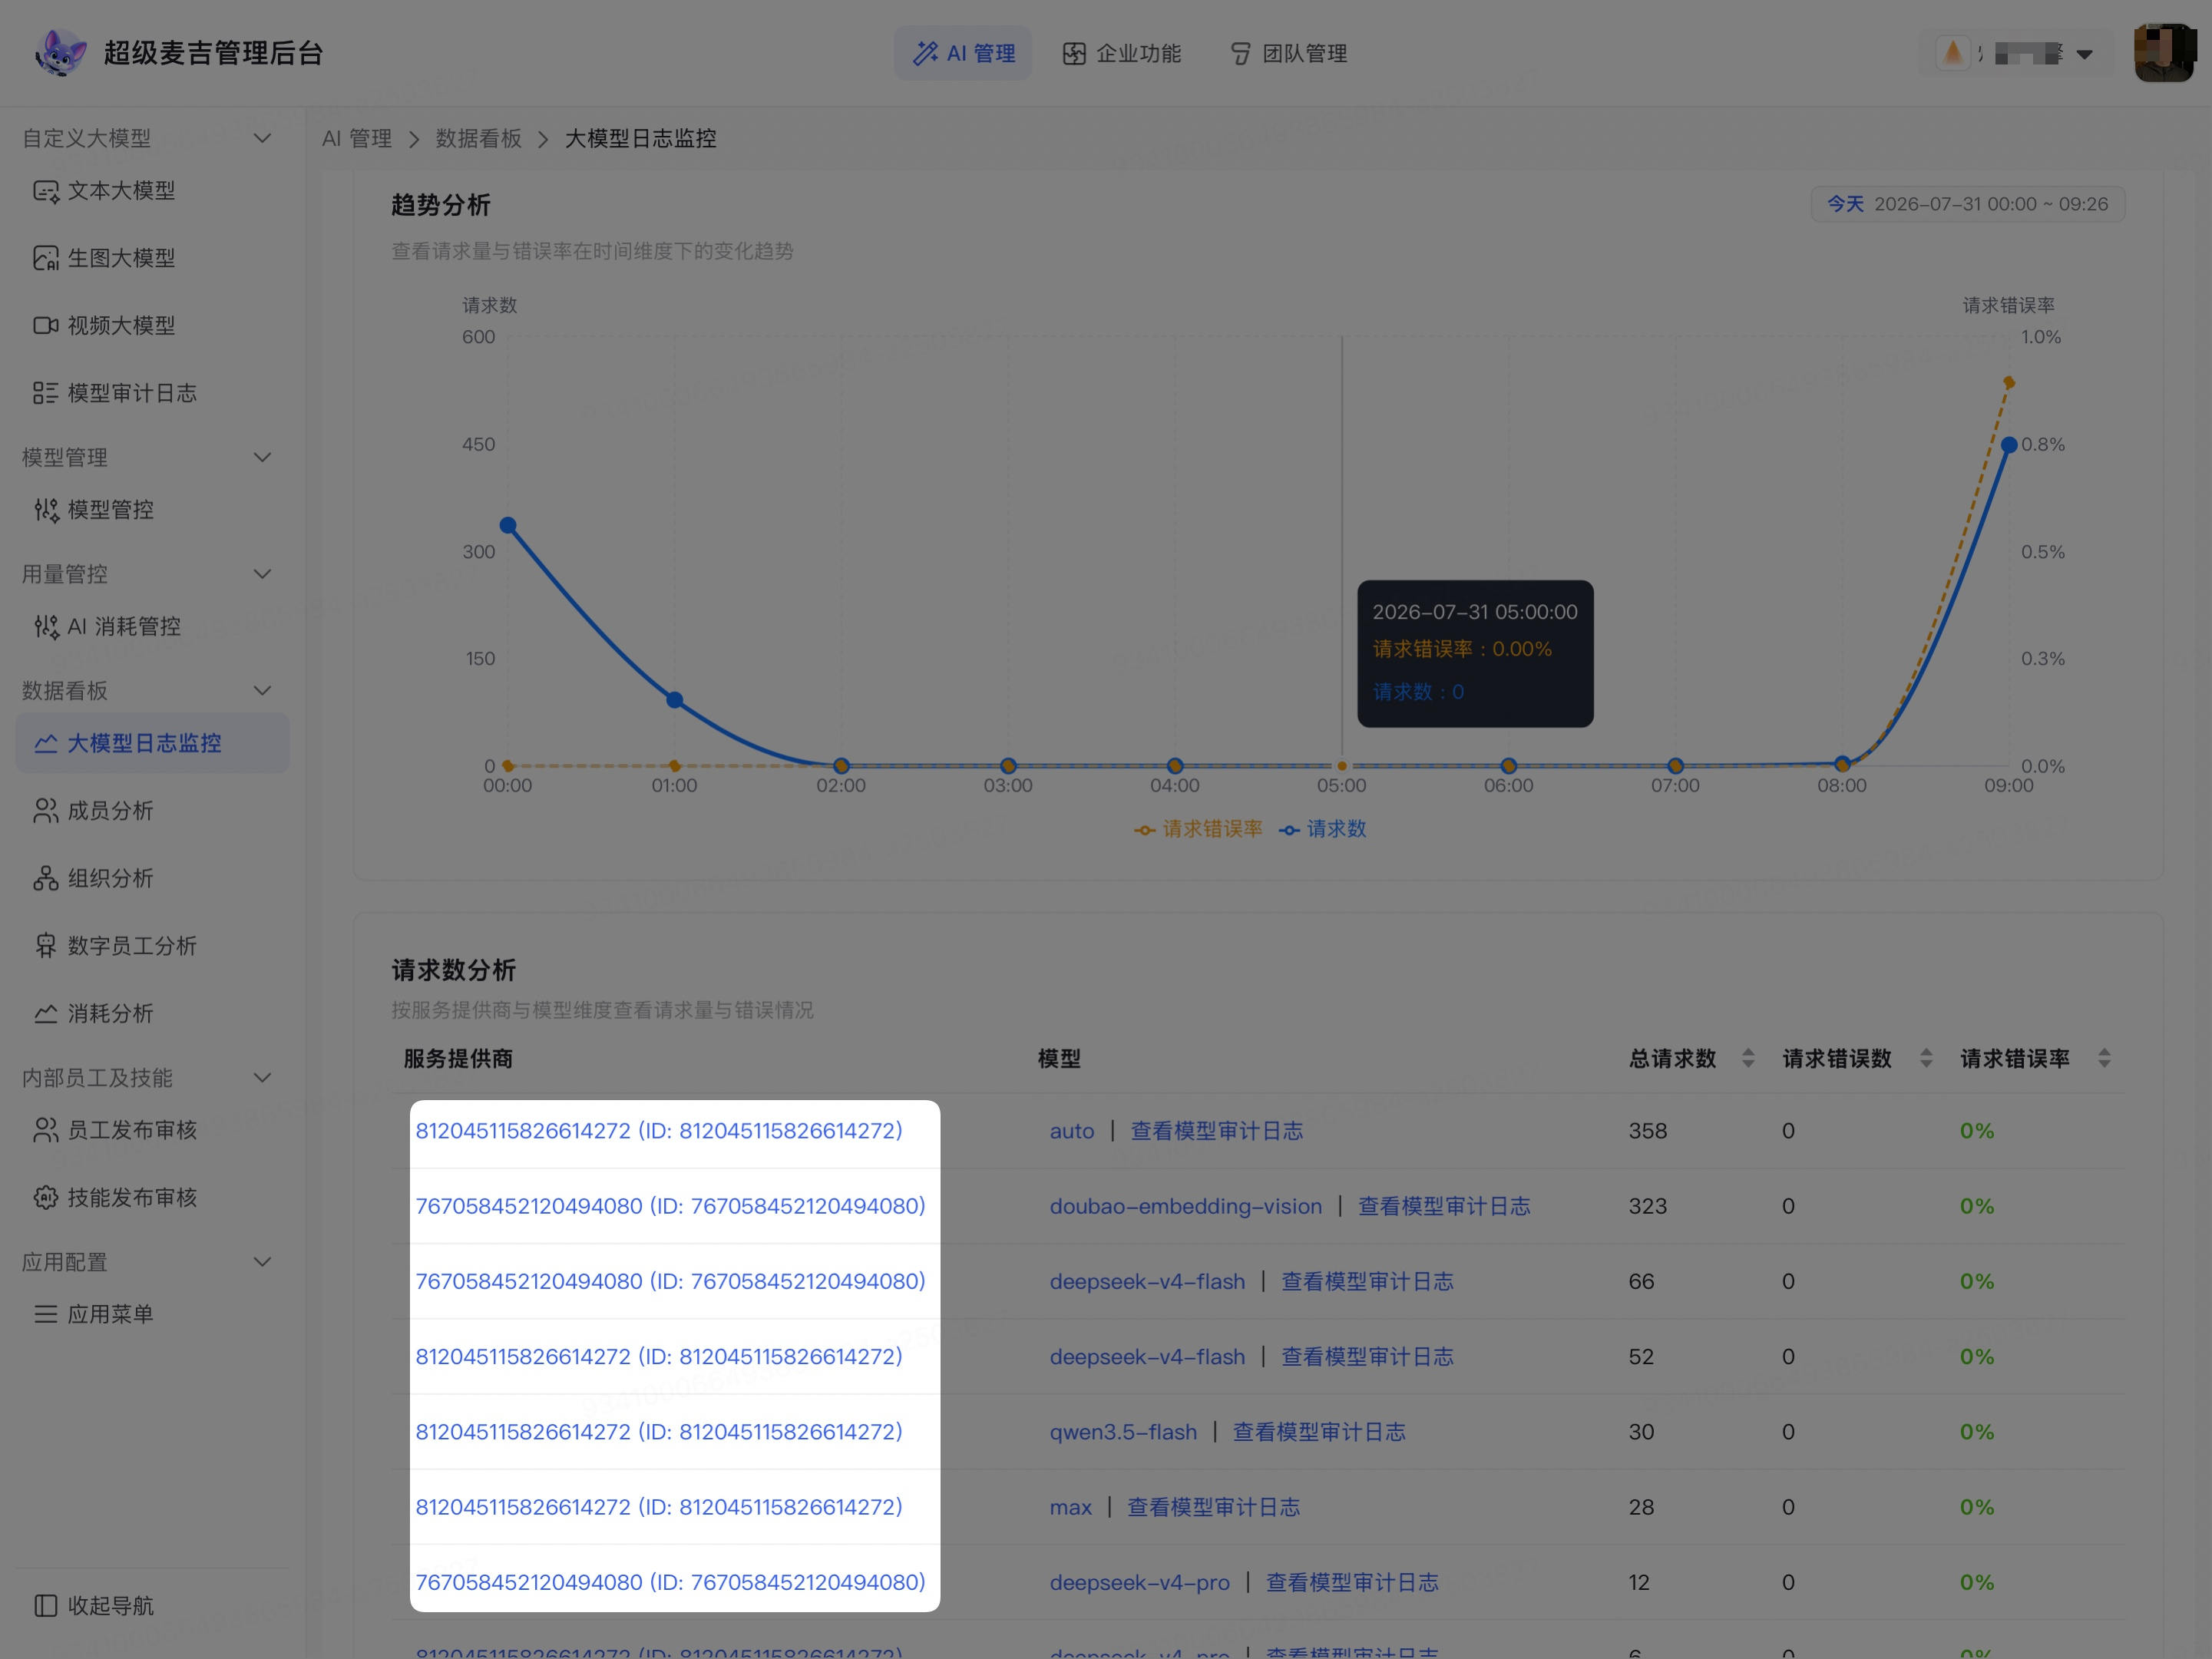
The service provider names, model names, and View Model Audit Logs in Request Count Analysis are displayed in blue text:
Click a service provider name to open the Service Provider Details dialog box.
Click a model name to open the Model Details dialog box.
If no corresponding details are available, the dialog box displays a message indicating that details for the service provider or model were not found.
Click View Model Audit Logs to continue viewing the model's invocation records.
Enter model auditing from the statistics results
Confirm the anomalous time period in the trend chart.
Find the service provider and model that require investigation in Request Count Analysis.
Click View Model Audit Logs next to the model.
After entering the model audit logs, check the current model condition.
Continue filtering by operation time and invocation status.
After finding the corresponding record, click View to open the details of a single invocation.
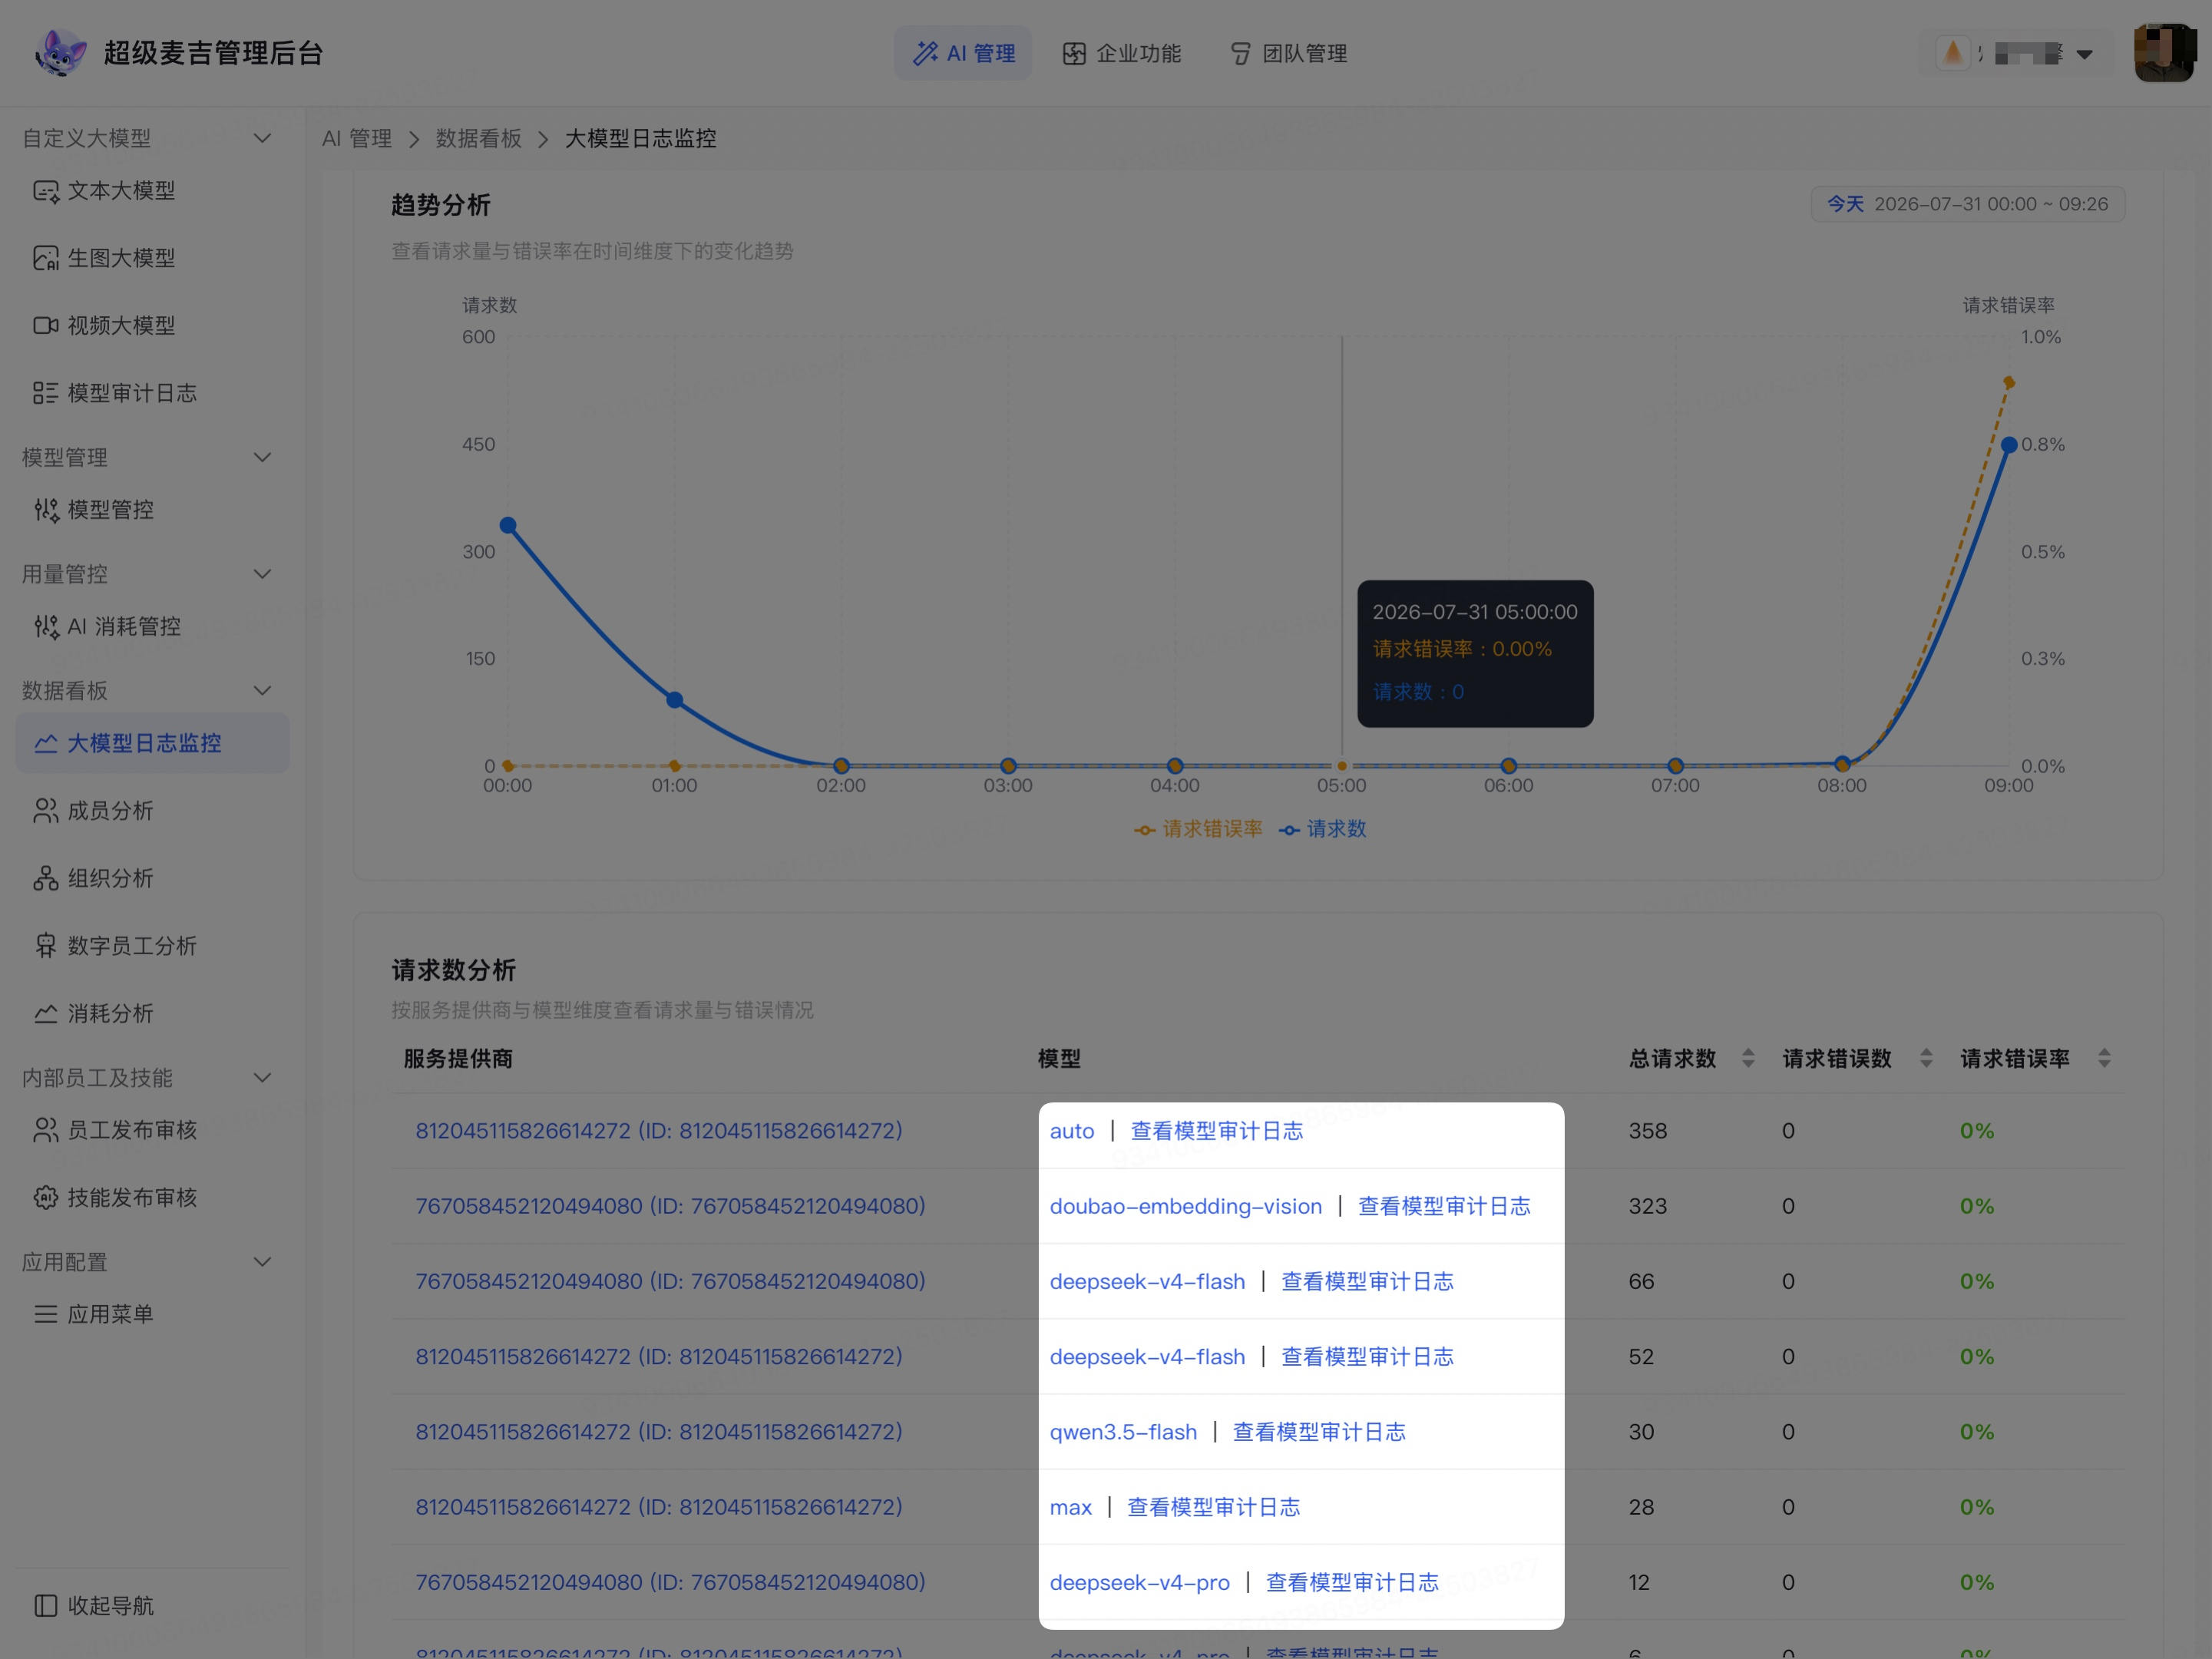
We recommend investigating anomalies in the following order:
Locate the anomalous time in LLM Log Monitoring
→ Confirm the anomalous service provider or model
→ Click “View Model Audit Logs”
→ Filter by the corresponding time and invocation status
→ View the details of a single invocation